U.S. Orthodontist: 35 Links, Page 1 Rankings, and 18× Organic Traffic in 6 Months
A multi-location orthodontics practice prepaid for 8 months at Foundation tier after the owner heard us on a podcast. Six months later: position #49 became page 1, organic traffic grew 18×, and 230 keywords sat in the top 3 positions.
The Story
A southern U.S. orthodontist with four offices had just completed a full rebrand and website relaunch. The practice had deep clinical expertise and a strong local reputation, but the new website was starting from scratch in Google’s eyes.
The owner is the kind of client who does his homework before making a call. He’d found us through podcast appearances, liked the methodology, and when he reached out, the conversation was short: one call, a clear problem (“my new site doesn’t rank”), and a decision.
He prepaid for 8 months of Foundation tier link building in December 2025. The timing was strategic — locking in the investment before year-end — but the motivation was simple: he had a new website and needed Google to trust it fast.
One call. One decision. No committee, no approval chain, no three-month pilot. An owner-operator who trusted the process and got out of the way. That trust turned into one of the cleanest local SEO growth curves we’ve produced.
The Starting Position
The audit told a clear story. The practice’s website had been live for a while under the old brand, but the relaunch had reset its authority. At campaign start:
| Metric | Dec 2025 (Start) |
|---|---|
| Domain Rating | 18 |
| Organic Traffic (Ahrefs est.) | 135/month |
| Keywords in Top 3 | 14 |
| Keywords in Top 10 | 45 |
| Referring Domains | 195 |
The numbers alone don’t tell the story. Here’s what the competitive landscape looked like for the practice’s highest-value keyword — [primary geo keyword]:
| Competitor | Position | DR | Organic Keywords |
|---|---|---|---|
| Competitor A | Top 3 | 27 | 2,340 |
| Competitor B | Top 5 | 20 | 234 |
| Competitor C | Top 10 | 29 | 2,769 |
| This Practice | #49 | 18 | 198 |
The practice was on page 5. Not page 2, not page 3 — page 5. For the keyword that brings patients through the door. Every potential patient searching for an orthodontist in their area was finding three competitors before they’d ever see this practice.
The audit identified the gap: the practice needed approximately 33 guest post placements distributed across its homepage and key location service pages to close the authority gap with its competitors. The on-page content was solid — the owner had been publishing articles that answered his patients’ most common questions, which gave us a strong content foundation to build authority on top of.
What We Built
The campaign architecture was engineered for a multi-location local business. Every link served a specific purpose in the authority distribution plan.
The engagement operated at our Foundation tier throughout — the right entry point for a practice that needed to close the authority gap efficiently:
Link Distribution — Where Authority Was Directed
| Target Page | Links | % of Campaign | Strategic Rationale |
|---|---|---|---|
| Homepage | ~20 | 56% | Brand authority — lifts the entire domain |
| Primary Location Page | ~10 | 28% | Highest-competition geo keyword |
| Location Page B | ~3 | 8% | Secondary market — lower competition |
| Location Page C | ~3 | 8% | Expanding geographic reach |
Homepage-heavy by design. For a multi-location practice, the homepage is the authority hub. Links to the homepage raise the tide for every location page. As domain authority grew, we progressively shifted more links to inner location pages — pushing authority to the pages that generate appointments.
Anchor Strategy
| Anchor Type | % | Purpose |
|---|---|---|
| Branded | ~70% | Natural profile, brand signal strength |
| Location-based | ~20% | Geographic relevance signals |
| Topical | ~10% | Contextual variations — “orthodontic care in [city]” |
A 70% branded anchor ratio is deliberately conservative. For a local practice building long-term authority, a natural anchor profile matters more than aggressive keyword targeting. The branded anchors build entity recognition; the location anchors provide geo-relevance. Together, they create a profile that looks like organic editorial coverage — because it is.
Placement Quality
| DR Tier | Links | % |
|---|---|---|
| DR 60+ | 22 | 64% |
| DR 50-59 | 6 | 17% |
| DR 40-49 | 3 | 8% |
| DR 30-39 | 4 | 11% |
64% of all placements at DR 60+. These aren’t generic directory submissions or low-authority blog comments. The guest posts were placed on medical publishers, lifestyle magazines, health and wellness platforms, and community news sites — publications with real readership and editorial standards.
Representative placements (described by category):
| Host Site Type | DR | Monthly Traffic |
|---|---|---|
| Medical education platform | 52 | 9,300 |
| Children’s advocacy organization | 68 | 37,000 |
| National news network | 68 | 5,700 |
| Luxury lifestyle magazine | 71 | 26,000 |
| Fashion & sustainability summit | 62 | 265,000 |
| Self-care & wellness platform | 61 | 130,000 |
This is what strategic link building looks like at Foundation tier — quality doesn’t scale down with the price point.
The Content Coaching Moment
When the owner asked us what kind of content he should publish on his own site, the advice was one sentence: “Write content that answers the questions your patients ask you every single day.”
He executed that advice exceptionally well. The practice’s blog now includes articles on common orthodontic conditions, treatment FAQs, and procedure guides — all topics that patients ask about in consultations. Those articles now drive thousands of clicks per month and rank in the top 3 for their respective queries. The guest post placements we built created the domain authority that gave those articles the trust signal they needed to rank.
The links built the authority. The content captured the demand. Together, they created a flywheel.
The Evidence
Month-by-Month Performance
| Date | Links (Cum.) | Ref. Domains | Top 3 KWs | Top 10 KWs | Traffic (Ahrefs) | Traffic Value |
|---|---|---|---|---|---|---|
| Dec 2025 (Start) | 0 | 195 | 14 | 45 | 135 | $126 |
| Jan 2026 | 6 | 245 | 28 | 76 | 439 | $288 |
| Feb 2026 | 12 | 271 | 33 | 85 | 622 | $660 |
| Mar 2026 | 18 | 283 | 118 | 229 | 1,386 | $1,888 |
| Apr 2026 | 24 | 296 | 190 | 386 | 2,834 | $4,289 |
| May 2026 | 30 | 431 | 207 | 424 | 2,997 | $4,190 |
| Jun 2026 | 35 | 498 | 230 | 416 | 2,486 | $3,737 |
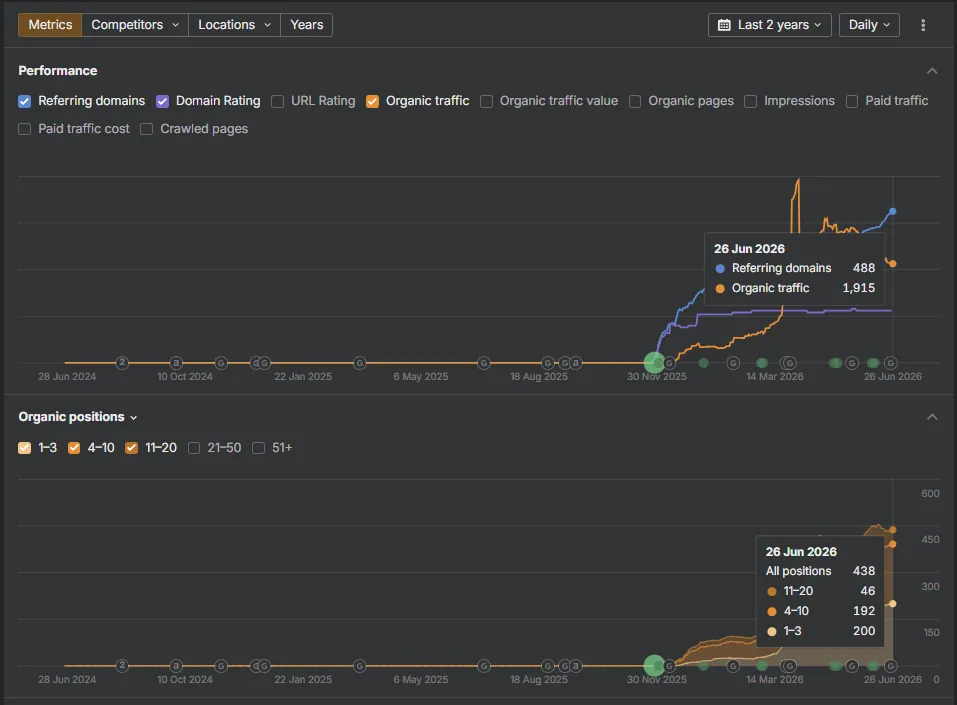
The Hockey Stick — March 2026
Look at March. Top-3 keywords jumped from 33 to 118 in a single month. Organic traffic tripled — from 622 to 1,386 visits. That’s the inflection point every link building campaign builds toward.
The mechanism is straightforward: the first 12 links (Months 1–2) needed time to be crawled, indexed, and their authority propagated through Google’s systems. By Month 3, the compound effect activated. It wasn’t gradual — it was a step function. One month the site was a mid-authority local page. The next month, Google recognized it as a credible authority in its space.
This is why link building requires patience and why campaigns fail when clients pull out after 60 days. The investment in Months 1–2 is what produced the results in Month 3. You can’t skip the foundation.
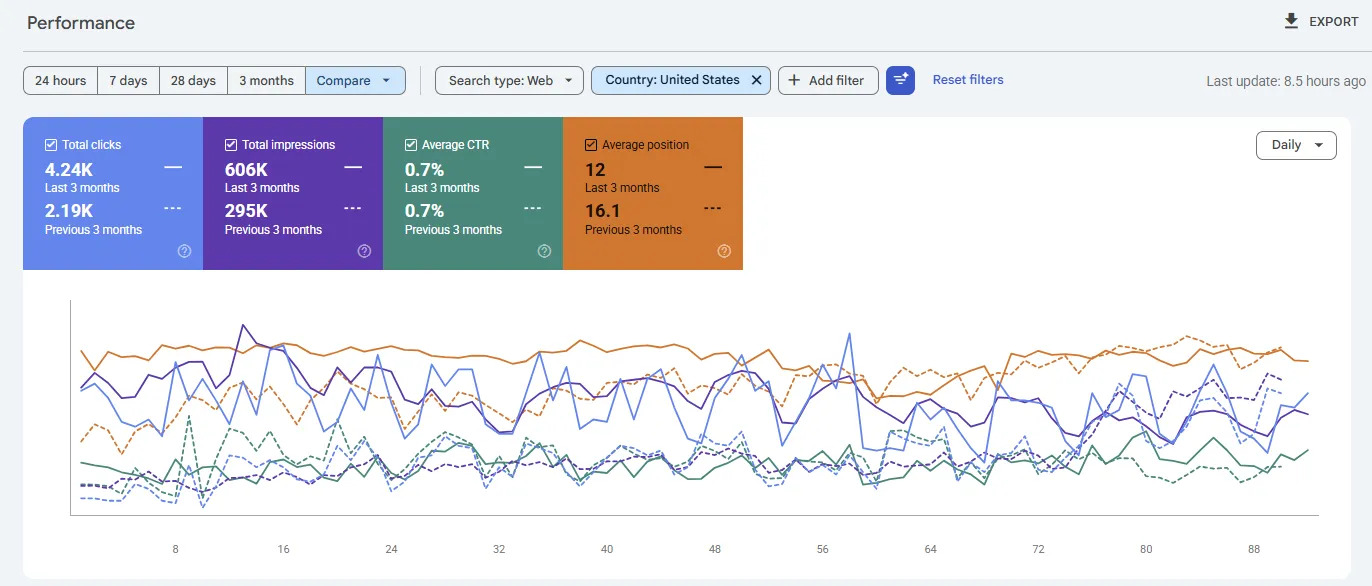
GSC Verified: The Click Growth Curve
Google Search Console confirms the trajectory independently:
| Period | Avg Daily Clicks | Avg Daily Impressions | Avg Position |
|---|---|---|---|
| Dec 2025 (pre-campaign) | 12 | 2,145 | 22.0 |
| Jan 2026 | 33 | 3,746 | 17.6 |
| Feb 2026 | 40 | 4,787 | 13.3 |
| Mar 2026 | 61 | 9,048 | 9.7 |
| Apr 2026 | 80 | 11,315 | 9.4 |
| May 2026 | 76 | 9,697 | 11.4 |
| Jun 2026 | 66 | 7,482 | 11.1 |
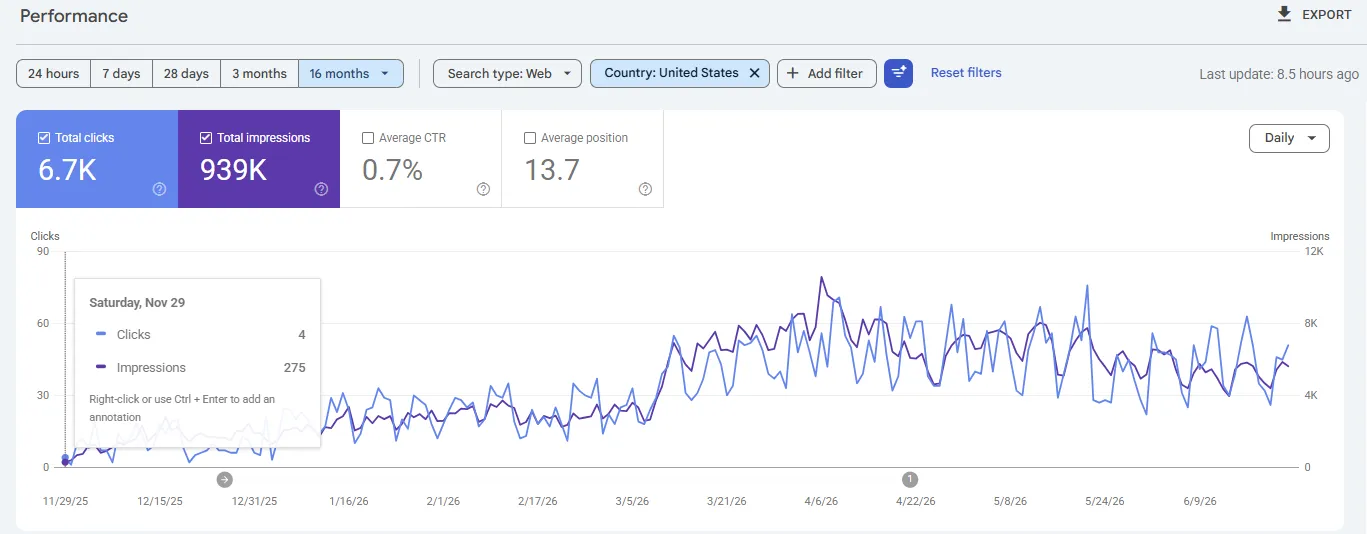
Daily clicks grew from 12 to 80 at peak — a 6.7× increase verified by Google’s own data.
The April peak at 80 daily clicks and 11,315 daily impressions represents the full compound effect of the first 4 months of links. The slight softening in May–June isn’t a regression — it’s seasonal. Impressions dropped (fewer people searching for orthodontists in summer), while keyword positions actually improved (top-3 keywords grew from 207 to 230). The rankings got better; the search demand is seasonal. Come fall, when families start planning orthodontic consultations again, this practice will be sitting on page 1 waiting.
Domain Rating Growth
| Date | Domain Rating | Change |
|---|---|---|
| Dec 2025 | 18 | — |
| Jan 2026 | 25 | +7 |
| Feb 2026 | 27 | +2 |
| Mar 2026 | 28 | +1 |
| Apr–Jun 2026 | 28 | Stable |
DR grew 56% — from 18 to 28. The bulk of the jump happened in Month 1 when the first batch of DR60+ links were indexed. The DR stabilized at 28, which put the practice above its primary local competitor (DR 27) — the exact authority threshold needed to compete for page 1 positions.
The Money Keywords — Page 1 Commercial Positions
The keywords that generate patient appointments — now with the practice ranking on page 1:
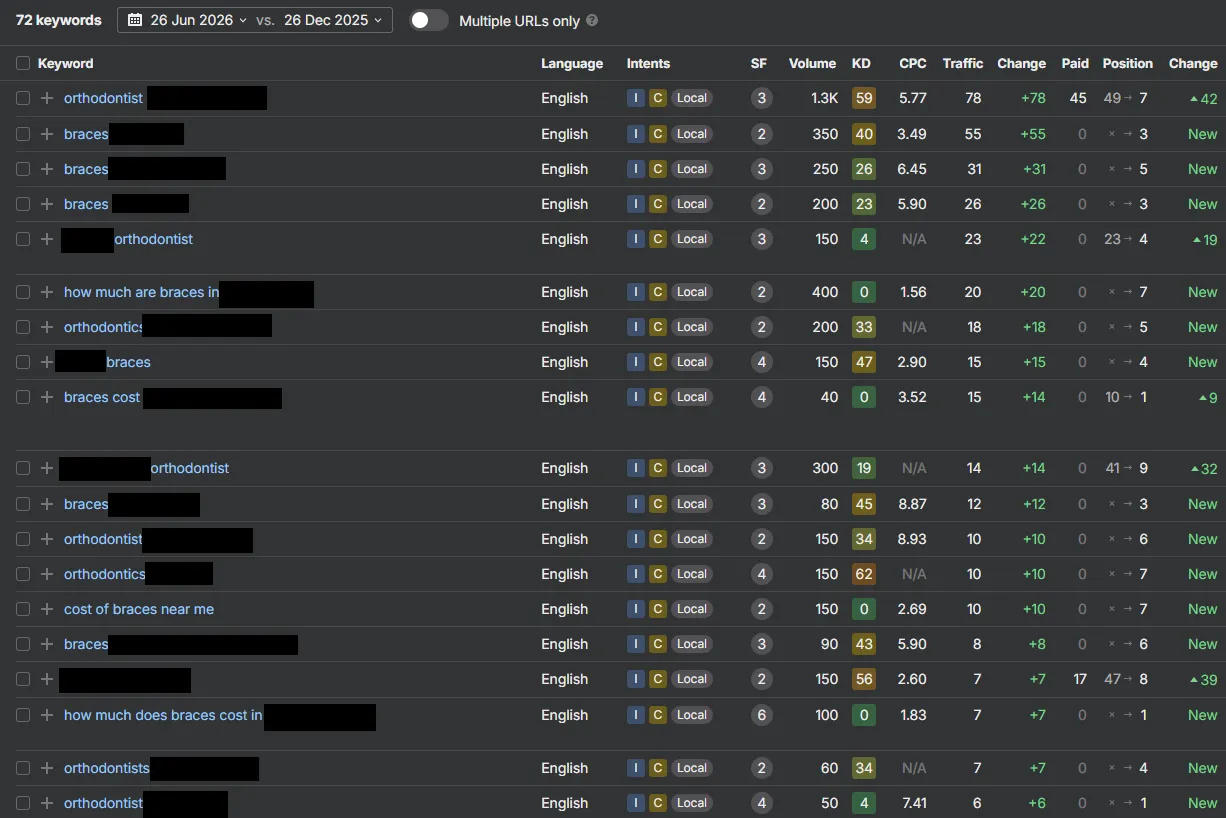
| Keyword | Audit Position (Jan 2026) | Current Position (Jun 2026) | Movement |
|---|---|---|---|
| [primary geo keyword] | #49 | ~#7 | +42 positions |
| [secondary geo keyword A] | Not tracked | #3 | New visibility |
| [secondary geo keyword B] | Not tracked | #2 | New visibility |
| [tertiary geo keyword] | #8 | Top 3 | Consolidated |
The highest-value keyword moved from page 5 to page 1. Not page 2 — page 1. Where patients actually look.
Referring Domains: The Compound Effect
| Date | Referring Domains | Monthly Change |
|---|---|---|
| Dec 2025 | 195 | — |
| Jan 2026 | 245 | +50 |
| Feb 2026 | 271 | +26 |
| Mar 2026 | 283 | +12 |
| Apr 2026 | 296 | +13 |
| May 2026 | 431 | +135 |
| Jun 2026 | 498 | +67 |
We built 6 links per month. But in May, referring domains jumped by 135 — more than 20× the monthly link volume. That’s the compound effect in action: as the site’s authority grew and its content started ranking, it began attracting natural editorial backlinks organically. The links we built created the conditions for more links to form naturally. The flywheel was spinning.
The Outcome
| Metric | Before (Dec 2025) | After (Jun 2026) | Change |
|---|---|---|---|
| Domain Rating | 18 | 28 | +56% |
| Organic Traffic (Ahrefs) | 135/mo | 2,997/mo (peak) | +2,120% (22×) |
| Keywords in Top 3 | 14 | 230 | +1,543% (16.4×) |
| Keywords in Top 10 | 45 | 416 | +824% (9.2×) |
| Referring Domains | 195 | 498 | +155% (2.6×) |
| GSC Daily Clicks | 12 | 80 (peak) | +567% (6.7×) |
| GSC Daily Impressions | 2,145 | 11,315 (peak) | +427% (5.3×) |
| Money Keyword Position | #49 | Page 1 (~#7) | +42 positions |
| Traffic Value (Ahrefs) | $126/mo | $4,289/mo (peak) | +3,304% |
The ROI Perspective
Monthly Investment: ~$1,875
Cost Per Link: ~$428/link (35 links delivered)
Traffic Value at Peak: $4,289/month (Ahrefs estimate)
Months to Recoup on Traffic Value Alone: ~3.5 months
Using the industry standard 5–8% conversion rate for dental/medical websites (PatientPop):
At peak: ~2,997 monthly visitors × 5% = ~150 inquiries/month
At 2% appointment rate = 3 new patients/month
3 patients × $5,000 avg case value = $15,000/month in new revenue
These are conservative estimates using industry benchmarks. The practice owner's actual conversion data may tell an even stronger story.
What the Top Pages Look Like Now
The practice’s content strategy — built on the advice to “write what patients ask you” — combined with the authority from our links to create these rankings:
| Page Topic | GSC Clicks (16 months) | Average Position |
|---|---|---|
| Common orthodontic condition guide | 2,910 | 5.3 |
| Treatment compatibility FAQ | 1,667 | 6.6 |
| Orthodontic appliance guide | 1,297 | 12.9 |
| Homepage | 735 | 19.4 |
| Prevention guide | 603 | 6.2 |
| Primary location page | 312 | 27.9 |
The blog content captures informational demand and builds topical authority. The location pages convert local patients. The links provide the authority signal that makes both layers work. This is the three-layer local SEO model: authority × content × location = rankings.
AI Visibility
The campaign was designed for Google Search. But the authority signals have already crossed over into AI platforms.
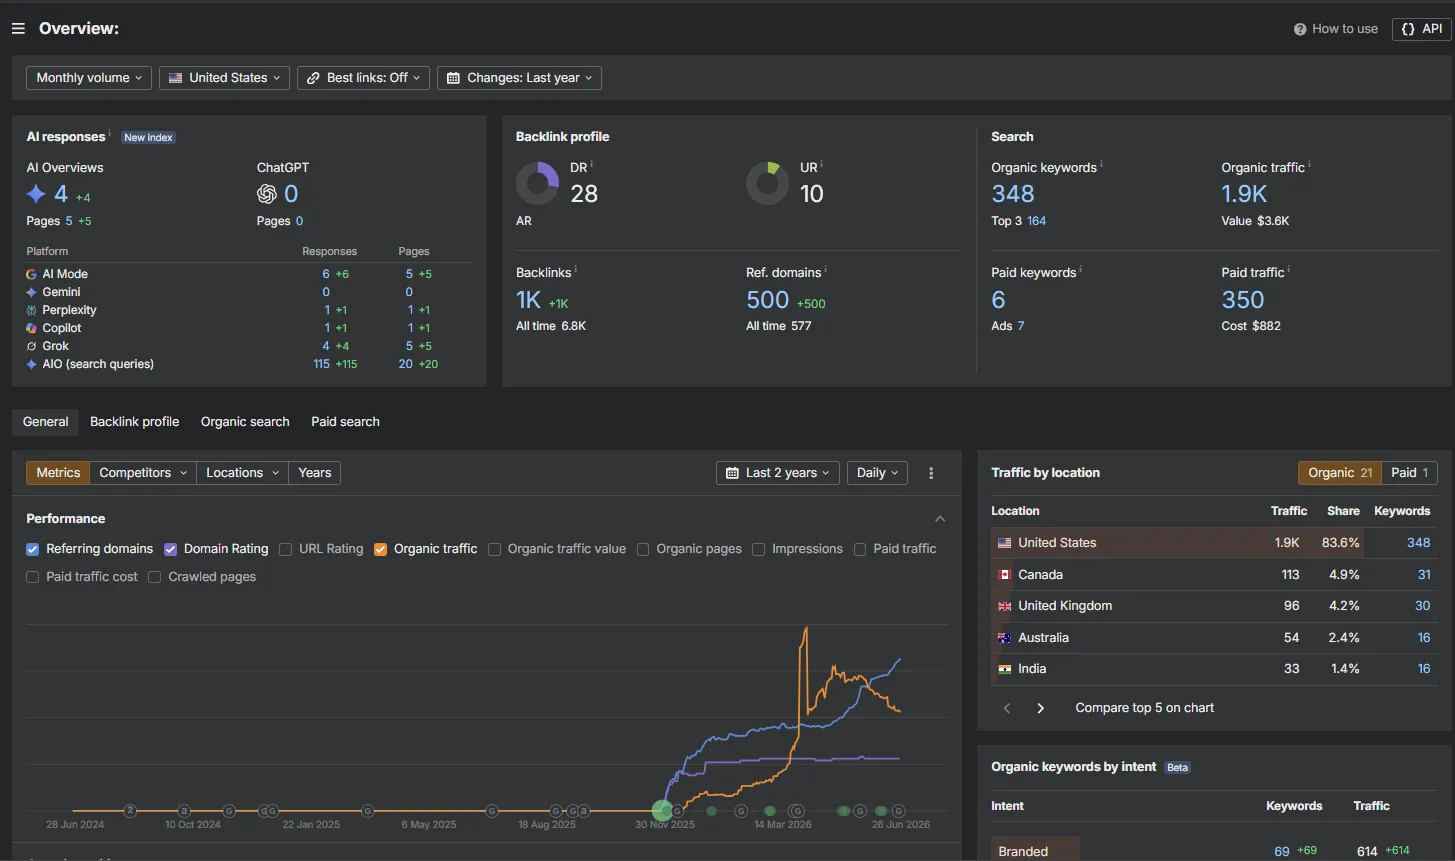
The Ahrefs overview shows the practice appearing in AI-generated responses across multiple platforms — 4 AI Overviews, 1 Perplexity citation, 1 Copilot citation, 4 Grok responses, and 115 AIO search queries triggering citations across 20 pages. This is unpaid visibility generated entirely by the editorial authority the guest posts created.
The practice’s informational content ranks in the top 3 for queries that Google frequently triggers AI Overviews for. As AI search adoption grows, the editorial authority built through this campaign positions the practice to be cited in AI-generated responses — the same mechanism documented in our health eCommerce case study, where 468 placements produced 283 AI citations across 6 platforms.
Strategic link building doesn’t just build rankings for today’s search. It builds the editorial consensus that AI platforms use to determine which brands to cite.
What This Case Study Teaches
01 — The hockey stick is real, but it requires patience
Nothing dramatic happened in Months 1–2. The links were being built, indexed, and propagated — but the rankings barely moved. Then Month 3 hit: top-3 keywords tripled from 33 to 118. Traffic exploded. The inflection point wasn’t gradual — it was sudden.
The data point: 12 links built in Months 1–2 produced a 3.6× increase in top-3 keywords in Month 3 alone. The investment precedes the return by 60–90 days. Clients who quit at day 45 never see what day 90 produces.
02 — For local businesses, homepage authority lifts everything
56% of links pointed to the homepage. Some might call that unfocused. The data calls it effective. As domain authority grew, every location page climbed — even the ones that received zero direct backlinks. The homepage acts as an authority reservoir that distributes trust to the entire site.
The data point: Location Page C received only 3 direct links but still achieved top-3 rankings for its geo keyword. The homepage authority flowing through internal links did the rest.
03 — Content + links = a flywheel, not a transaction
The owner’s blog content — answering the questions patients ask every day — was already good. But it wasn’t ranking because the domain lacked authority. Our links provided the authority; his content captured the demand. By Month 5, the site was attracting 135 new referring domains in a single month — more than 20× the monthly link building volume. The content was now earning links organically because it had the authority to rank where people could find it and reference it.
The data point: We built 6 links/month. In May, the site gained 135 referring domains. The flywheel was spinning. This is why strategic link building at Foundation tier isn’t a cost — it’s the ignition for organic growth that compounds long after the campaign ends.